PJM Interconnection Queue Report | An M&A perspective
A data-driven look at the PJM interconnection queue: cost variation, structural risk, and the 2027 bottleneck, written for renewable M&A teams.
Report
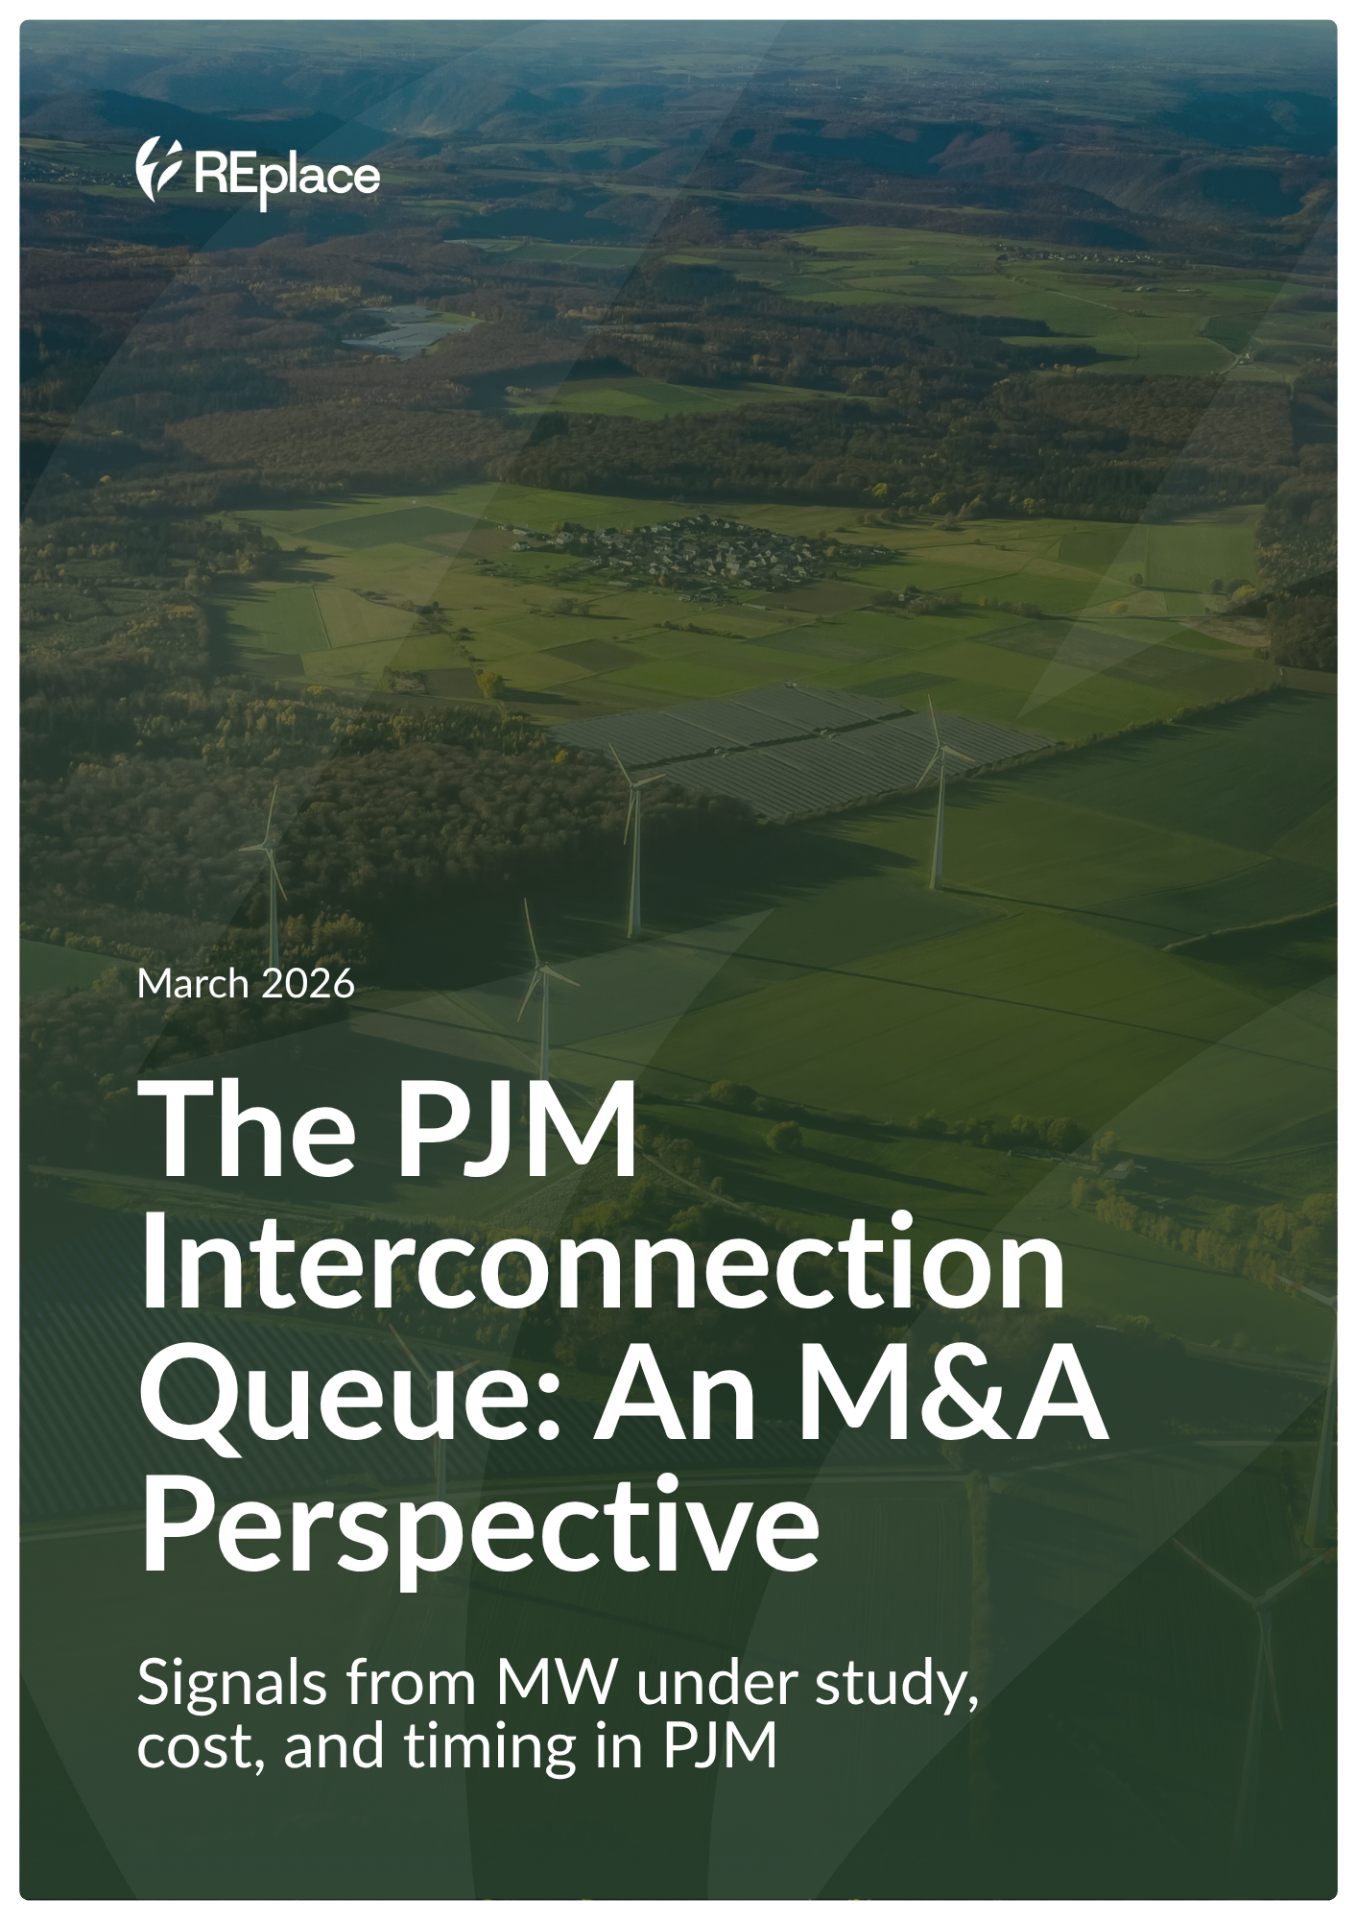
The PJM Interconnection Queue: An M&A Perspective
Cost, timing, and ownership signals across 100,000+ MW under study in the PJM queue.
Access the full analysis
PJM Interconnection Queue: An M&A Perspective — report cover
Key finding
Interconnection cost varies significantly across PJM
Opportunity is concentrated in specific parts of the queue.
Interconnection Cost Distribution
$0.05/W → $0.33/W
across PJM
Virginia
$0.33/W
State 2
$0.21/W
State 3
$0.14/W
State 4
$0.09/W
State 5
$0.05/W
Interconnection costs vary significantly by region
100,000+ MW under study · Solar, Storage, Wind, Natural Gas · EP, TC1, TC2 process cycles
What we found
What the data shows
Cost hotspots
Where upgrade costs are concentrated across the queue.
Where queue volume is crowded
Where project volume is highest and developer activity is densest.
COD timing pressure
Where multiple projects are targeting the same COD windows.
Ownership concentration
Where a small number of developers hold large portions of the queue.
Key insight
Project selection carries structural risk
Cost, timing, and ownership patterns shape which projects are realistically actionable. Without this view, teams spend time on projects that won't move forward, while missing stronger opportunities elsewhere in the queue.
The report quantifies where these risks concentrate — by region, by developer, and by timeline.
Structural Risk Factors
Interconnection cost variance 85 %
Ownership concentration 62 %
COD clustering 74 %
Upgrade cost exposure 58 %
Relative impact across PJM queue projects
Project Density by Target COD Year
2025
2026
2027
2028
2029
2030+
High concentration of projects targeting 2027
Supporting insight
The 2027 bottleneck
A large share of projects in the PJM queue are targeting similar COD timelines in 2027. This clustering concentrates timelines into a narrow window across parts of the queue, making relative positioning and sequencing more important.
See the full breakdown
Inside the analysis
- 100,000+ MW of projects analyzed
- Cost, timing, and ownership signals across the full queue
- Project-level breakdowns across regions and clusters
- Identification of structural bottlenecks and patterns
Download the report
See where cost, timing, and ownership concentrate across PJM
Enter your details to access the full analysis.
Go deeper
Explore the queue at the project level
The report shows the structure of the PJM queue. iQueue explores the project level, with live cost and ownership data on every asset.